Real Life = Real Math Lesson
Math is fun when we use it for things that interest us. Here is how we took Real Life and turned it into a lesson for Real Math.
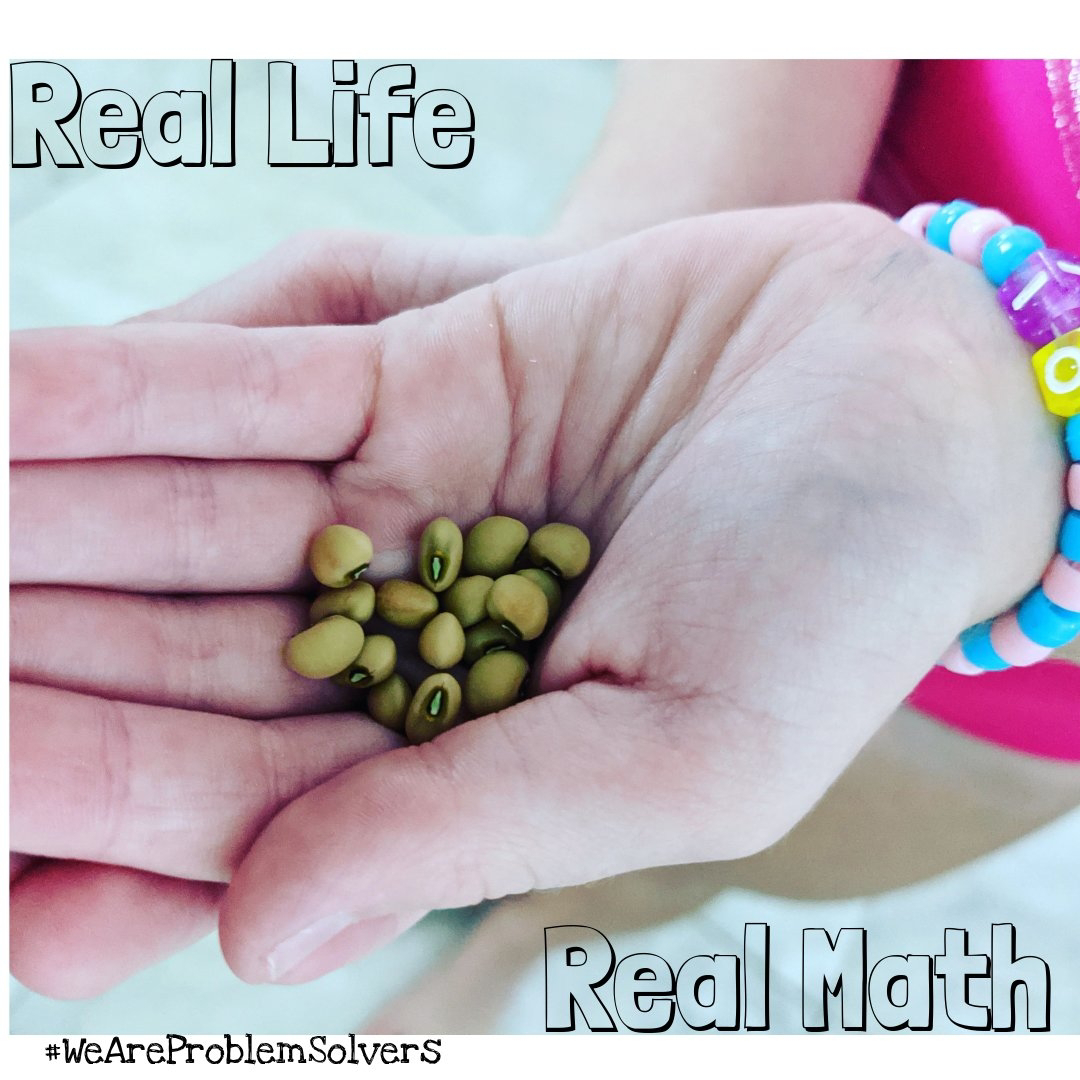 Here is a photo of a child's hand with seeds the she harvested from the plants in her garden.


 she even made a great printable.

Plants Meet Math
We grew cow peas (Vigna unguiculata) together. We watched them grow from seed to seed. Then we harvested.
There was a ruler on the table, when we walked into the house, so our daughter began measuring the length of the pods. A few of the pods were dry and cracking already, so she opened them to count the seeds.
Little sisters decided to get busy with this activity, too. The magnifying loup was our toddler's favorite tool. She spent some time looking at seeds with the loup and deciding which ones she wanted to keep. Here is a photo of our toddler with the magnifying loupe.
Follow their Lead
When I saw the drive to complete this task, I made up a math sheet to keep their interest. I have shared an image of the paper below.
Collect Data
The image is of lined paper with a column for seed pod lengths and anither column with number of seeds per pod. She collected this data herself.
Basic Statistics
Next I asked her to fill in some information on averages for this data set. I asked for the mean, median, and mode. I explained how to solve for each type of average.
Make Predictions
Next I asked her a question that directly related to her data. I asked her how many seeds does she expect to see in a pod that is 5 inches long. In her data that she collected, she measured two pods that were each 5 inches long. They each held 10 seeds. She said she would expect to find 10 seeds if she had another pod that was 5 inches long. She noticed a trend and made an educated guess - a prediction based on the data she collected.
Graph the Data
Next she took her data and filled in a scatter plot. When we spoke about this way of presenting the data we used the terms x axis and y axis. These were new to her, but she picked up quickly.
Words on this picture of a handwritten worksheet say:
"Seed pod length (in), # seeds per pod"
Average!.
Mean, median, mode.
How many seeds do you expect to get from a pod that is 5 inches long.
Draw a scatter plot with your data.
A graph is labeled with pod length on the x axis and number of seeds on the y axis.
Write it Up
Have you noticed that this little activity gave us the guts of our very own lab report? Now it's time for us to write it up!
Here are some questions we can ask as we write up our work.
Title: Can you think of a fun name for this activity?
Author: Your name
Introduction: Why do it?
Methods: How did you do it?
Results: What did you see?
Discussion: Why is that?
Conclusion: What's next?
Check out our daughter's report from this activity here: https://docs.google.com/document/d/1nKxBiVRfO0F1P8qG_WosRjUnqwbLGj7oaY7WEMQ7ifA/edit?usp=sharing
Now Choose Your Project!
We chose to work with plants.
What data do you feel like collecting today? Can you quantify it? Let's analyze that data and put it all together into a little report!
Why?
If your child can do this activity, they'll have a model for how they can collect and analyze quantitative data to make more accurate predictions about their world. Math is an important part of the scientific process.
Barefoot Mom's Garden Learning
Do you want to explore some garden learning activities with another mother's activities? She covers so many great topics from the garden.
Check out this link for more info!
Comments
Post a Comment